

Overview
The Analytics section inside the Ollang Project Management Dashboard helps organizations:- monitor localization performance,
- evaluate multilingual quality,
- understand credit consumption,
- track operational delivery,
- benchmark AI performance,
- and analyze human review behavior.
- Order performance,
- AI localization quality,
- Human review behavior,
- QC progression,
- operational delivery,
- and billing-related insights.
Analytics Visibility and Permissions
Access Requirements
Analytics visibility requires:- Access Billing permission.
- Analytics,
- Payment Overview,
- Credit Overview,
- QC performance,
- and financial reporting.
Standard Project Management Users without Access Billing permission cannot access the Analytics section.
Analytics Sections
The Analytics dashboard currently includes:Order Analytics
Analyze localization activity across Orders.
Payment Overview
View invoicing and outstanding payment information.
Credit Overview
Monitor AI credit availability and usage.
Recent Order Details
Review recently processed localization Orders.
QC Score Progression by LLM
Understand localization quality progression over time.
Average Human Edit Percentage
Understand how much AI-generated output required human modification.
Order Analytics
Overview
Order Analytics helps organizations understand:- localization volume,
- workflow activity,
- delivery performance,
- language pair trends,
- and operational behavior.
- Order types,
- language pairs,
- delivery priorities,
- and time periods.
Order Analytics Filters
Order Analytics supports the following filters:Start Date / End Date
Analyze operational performance within a selected timeframe.
Order Type
Filter analytics by localization workflow type.
Source Language
Analyze localization performance from a selected source language.
Target Language
Analyze localization behavior for specific target markets.
Order Level
Analyze AI-only or AI + Human Review workflows.
Delivery Type
Filter between standard and rush delivery workflows.
Example Analytics Query
Example: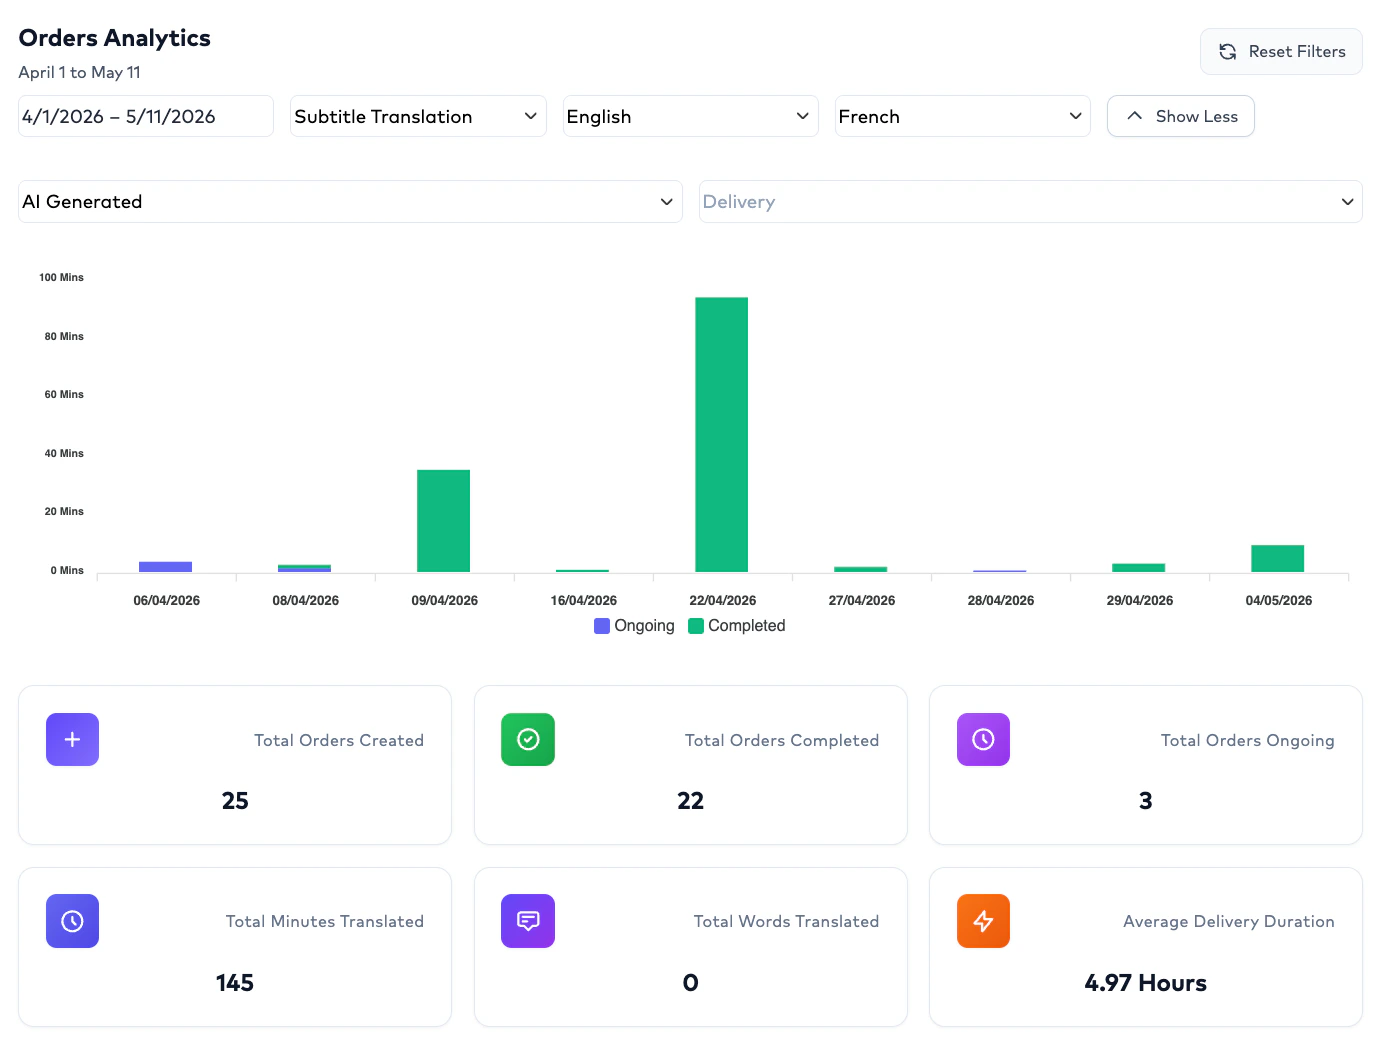
Credit Overview
Overview
Credit Overview provides visibility into:- total AI credits,
- remaining AI credits,
- and localization consumption.
- manage localization budgets,
- understand operational usage,
- and monitor available processing capacity.
Credit Visibility
The dashboard currently displays:- available localization capacity,
- and current AI usage availability.
Payment Overview
Overview
Payment Overview provides billing-related visibility for operational teams. This section helps organizations understand:- invoice-related activity,
- pending payment behavior,
- and financial status.
Payment Information
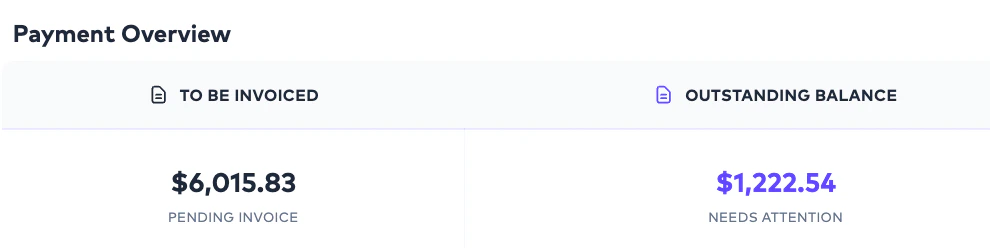
The Payment Overview currently includes:To Be Invoiced
Pending operational amounts expected to be invoiced.
Outstanding Balance
Existing balance pending payment resolution.
Recent Order Details
Overview
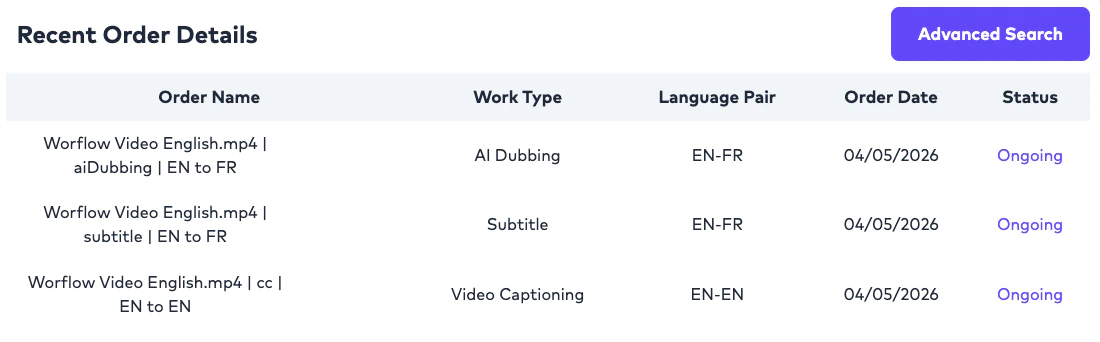
Recent Order Details provide operational visibility into:- recently processed Orders,
- localization activity,
- and workflow execution.
- quickly monitor activity,
- identify recent deliveries,
- and review localization progress.
Typical Order Details
Recent Orders commonly include:- Order information,
- localization workflow details,
- language pair information,
- status,
- and operational delivery details.
Advanced Search Navigation
The Analytics section includes:- Advanced Search
- the Global Search page.
- deeply investigate Orders,
- search historical activity,
- and perform operational tracking.
QC Score Progression by LLM
Overview
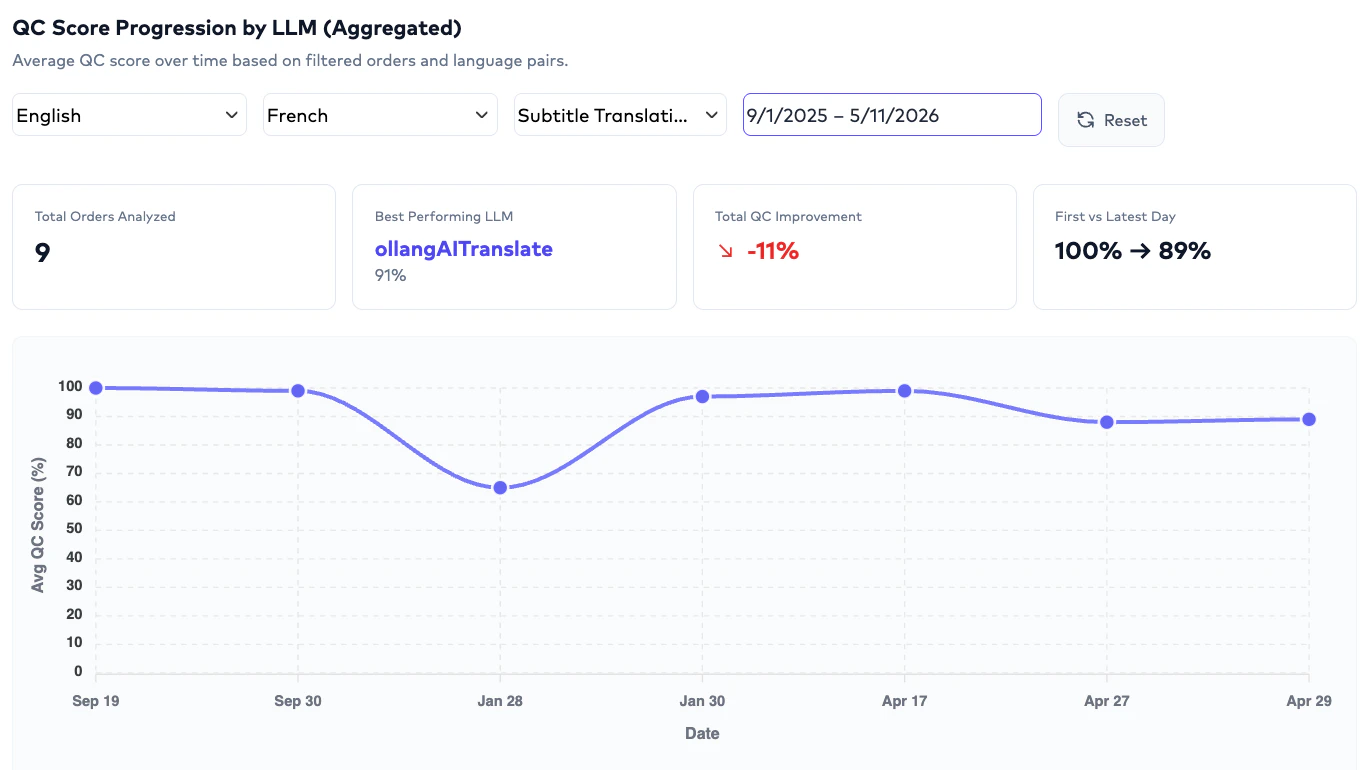
QC Score Progression by LLM provides:- aggregated localization quality trends.
Available Filters
QC Score Progression supports:Start Date / End Date
Analyze localization quality across a selected timeframe.
Source Language
Filter by source language.
Target Language
Filter by target language.
Order Type
Analyze QC progression for a specific workflow.
How QC Progression Works
The system analyzes:- average QC scores,
- quality progression trends,
- and localization improvements.
- quality evolution,
- workflow effectiveness,
- and localization performance over time.
Important Clarification
QC Score Progression is an aggregated trend analysis and not a side-by-side comparison of every provider run.
- first QC score average,
- latest QC score average,
- best-performing LLM,
- and quality improvement trends.
Average Human Edit Percentage
Overview
Average Human Edit Percentage helps organizations understand:- benchmarking provider quality,
- evaluating localization efficiency,
- identifying problematic language pairs,
- and optimizing workflows.
Human Edit Filters
Average Human Edit Percentage supports:Start Date / End Date
Analyze human edit behavior within a selected timeframe.
Source Language
Analyze edit behavior for specific source languages.
Target Language
Analyze edit behavior for target markets.
Order Type
Evaluate edit percentage across localization workflows.
Measurement Methodology
Human Edit Percentage is measured at:- segment level.
- overall average human edit percentage,
- and Order-level edit details.
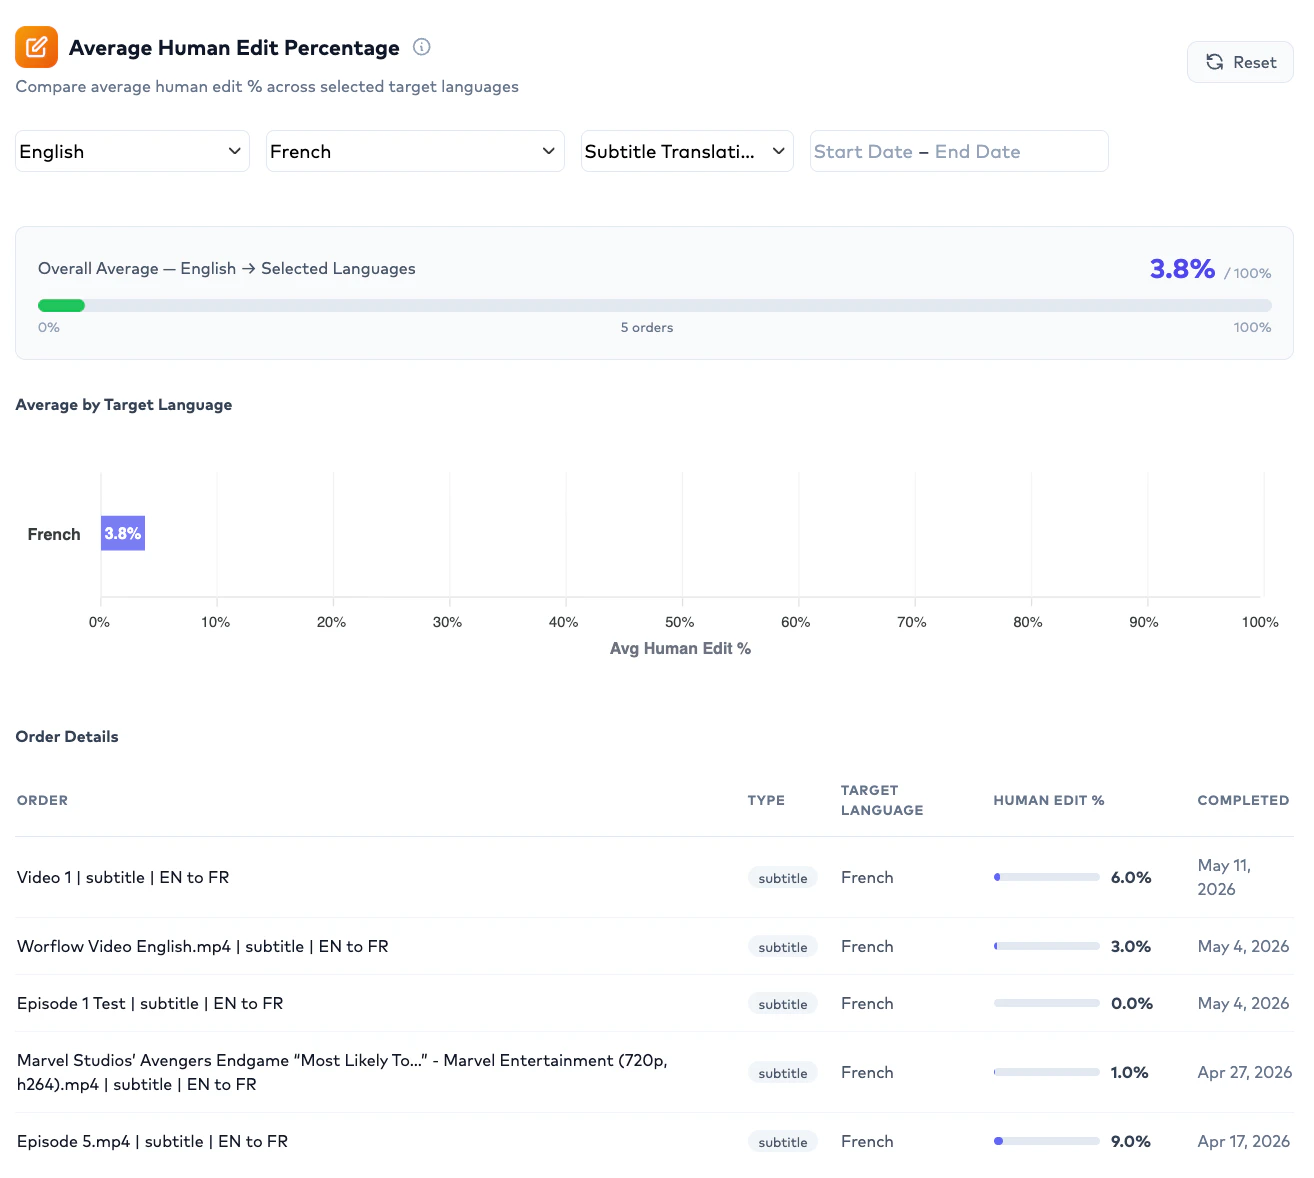
Example Human Edit Analysis
Example:- efficient workflows,
- high-performing providers,
- and problematic localization patterns.
Using Analytics for Workflow Optimization
Organizations commonly use Analytics to answer questions such as:- improve localization quality,
- optimize provider selection,
- reduce review effort,
- and benchmark multilingual performance.
Best Practices
Organizations typically achieve the best outcomes by combining:- AI quality,
- human correction effort,
- localization consistency,
- and long-term optimization opportunities.
Important Operational Notes
Who can access Analytics?
Who can access Analytics?
Only users with Access Billing permission can access the Analytics section.
Can QC Score Progression compare every provider side-by-side?
Can QC Score Progression compare every provider side-by-side?
No. The analytics show aggregated quality progression and best-performing LLM insights rather than run-by-run comparisons.
What does Human Edit Percentage measure?
What does Human Edit Percentage measure?
It measures how much AI-generated content was modified during human review at segment level.
Can users filter Analytics by language pair?
Can users filter Analytics by language pair?
Yes. Analytics support Source Language and Target Language filtering.
What does Advanced Search do?
What does Advanced Search do?
Advanced Search redirects users to the Global Search page for deeper operational investigation.
Can Analytics help optimize workflows?
Can Analytics help optimize workflows?
Yes. Analytics help organizations benchmark localization quality, provider effectiveness, and human review effort.